How we began
We started by reviewing the feedback section on the Google Playstore and the IOS App Store, which provided insights into our user frustrations and delights about the product.
We collaborated with the customer experience team to get more information about our customer’s behavioral patterns, experience with the existing mobile app, and general feedback about the product.
Problem
The drop-off rate on the account opening process was the bank’s utmost concern. Most customers started the process in-app but could never complete it. Some users had to visit the bank’s nearest branch to complete the process because they couldn’t do so with the app.
Another major problem was the accessibility and discoverability of the bank’s services on the main dashboard. Most of the app features lacked engagement because users couldn’t locate them.
The Team:
- Product designer
- Product owner
- Product manager
- Customer Experience
- Enterprise Architect
- Project manager
- Business Analyst
- Backend developer
- Frontend developer
- Quality Assurance Tester
- Application manager
My roles:
- Product Designer
Conversations with our customers
The team conducted user research interviews with our customers to better understand their frustrations with the existing mobile app.
We interviewed 25+ customers aged range between 18- 50 years old across 15 states in Nigeria. Some interviews were face-to-face, while the others virtually because of time constraints.
Research Goals:
1. Identify and understand issues with the account opening process.
2. Understand problems our customers encounter on the mobile app.
3. Get insights about user behaviours and patterns.
Discoveries from the research.
The user research revealed some of the concerns users had regarding the onboarding process and generally about the app. It also gave us an idea of some of the things we needed to prioritize for the redesign.
We categorized some of the issues into different epics.
Dashboard Navigation:
40% of the customers interviewed could not navigate the app nor find some of the most significant app features.
The user research revealed that the information architecture of the app was an immense problem for the customers.
Account Opening:
80% of the customers stated that the main reason for dropping off is because it was mandatory to fund the new account even before getting an account number.
Another issue was the time taken to validate documents to open the accounts. Some even complained of getting errors and not knowing what to do next.
Other Insights from the research
1. Inability to share and download transaction reciept.
2. Lack of access to quick services on the dashboard
3. No recent transfers on the funds transfer page.
4. Users can’t search for a biller on the bills page.
5. Some users want to be able to request for cards without a branch visit.
6. Long onboarding account opening process.
Simplifing the structure and ease access to key features
The app’s information architecture had discoverability issues, which led to users not having access to some services even though they were available.
In redesigning the architecture, we conducted an online card sorting exercise with both internal and external stakeholders. This exercise guided the decision-making process for the new structure and a more effective grouping of the dashboard features.
Card Sorting:
We conducted a card sorting exercise with 30 Participants. We used an online tool called Optimalsort for the card sorting exercise. After this, we analyzed the results and identified how participants grouped features they wanted to see together.
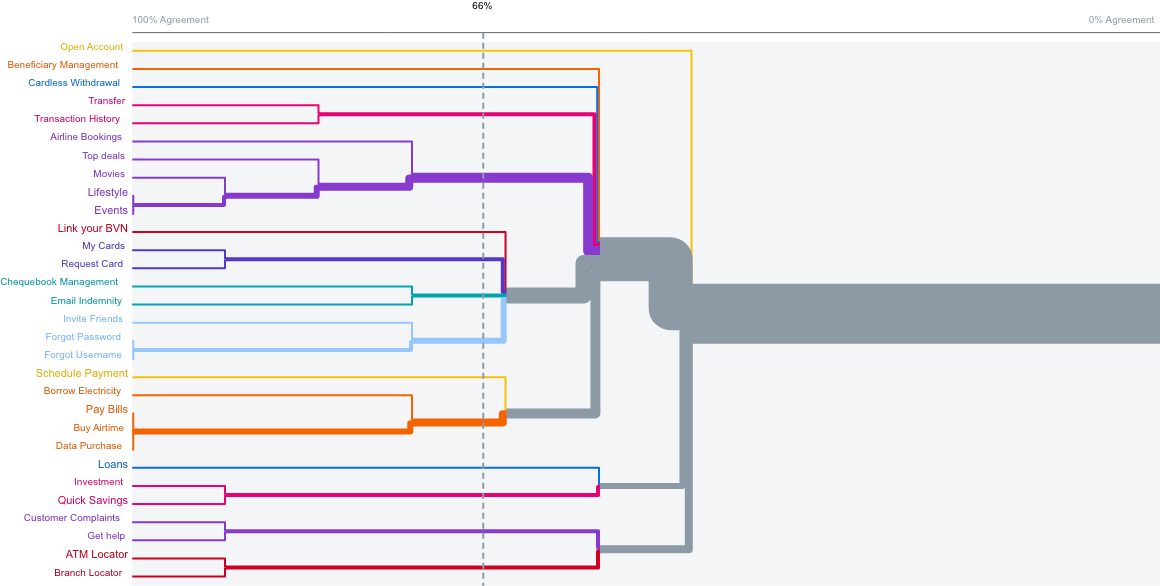
The dendrogram extracted from the exercise showed us all the services users grouped. Similar items have the same color.
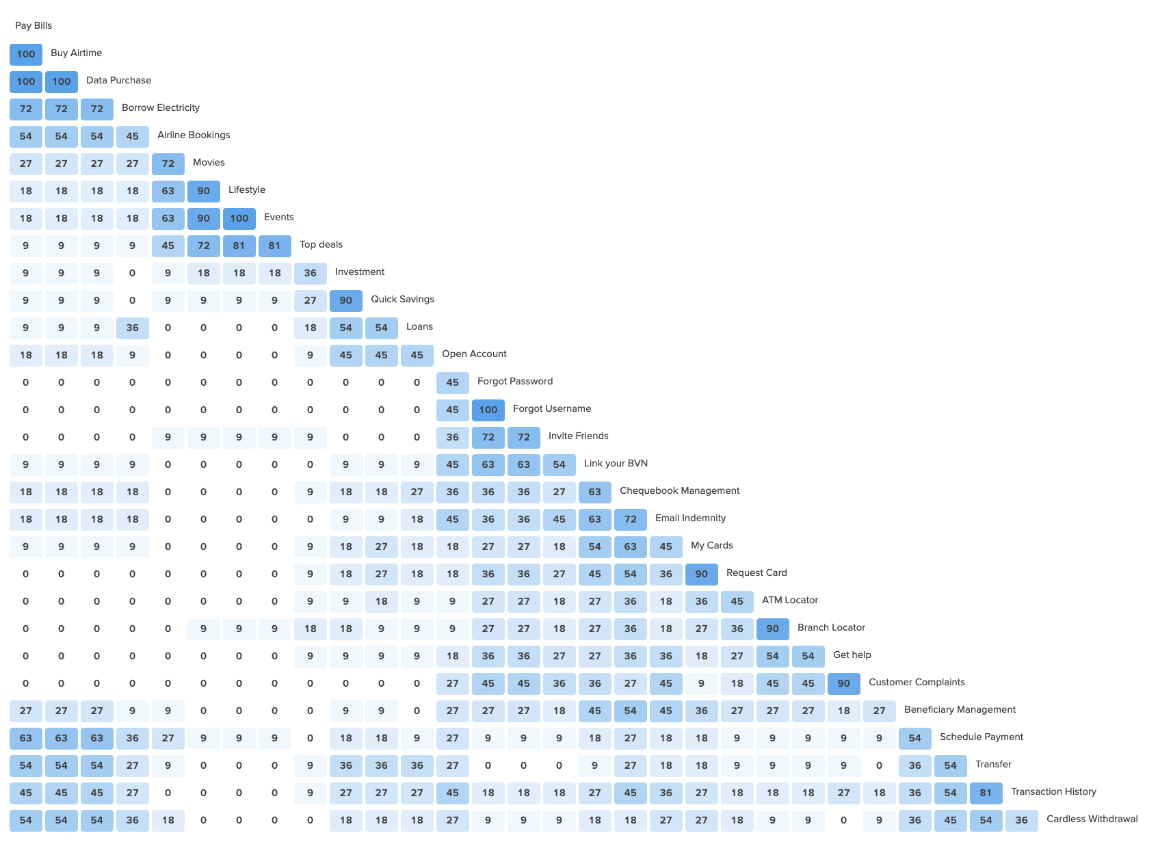
The similarity matrix is a simple representation of pair combinations. It gave us a quick insight into the cards the participants paired together in the same group the most often. The darker the blue where two cards intersect, the more often they were paired together by participants.
Finding a better content organization
One interview participant had mentioned that she had to call a contact center representative to explain how to book her flight ticket on the app.
With that in mind and several other feedback from the interview, the structure of the dashboard content for better discoverability was essential to the success of the app redesign.
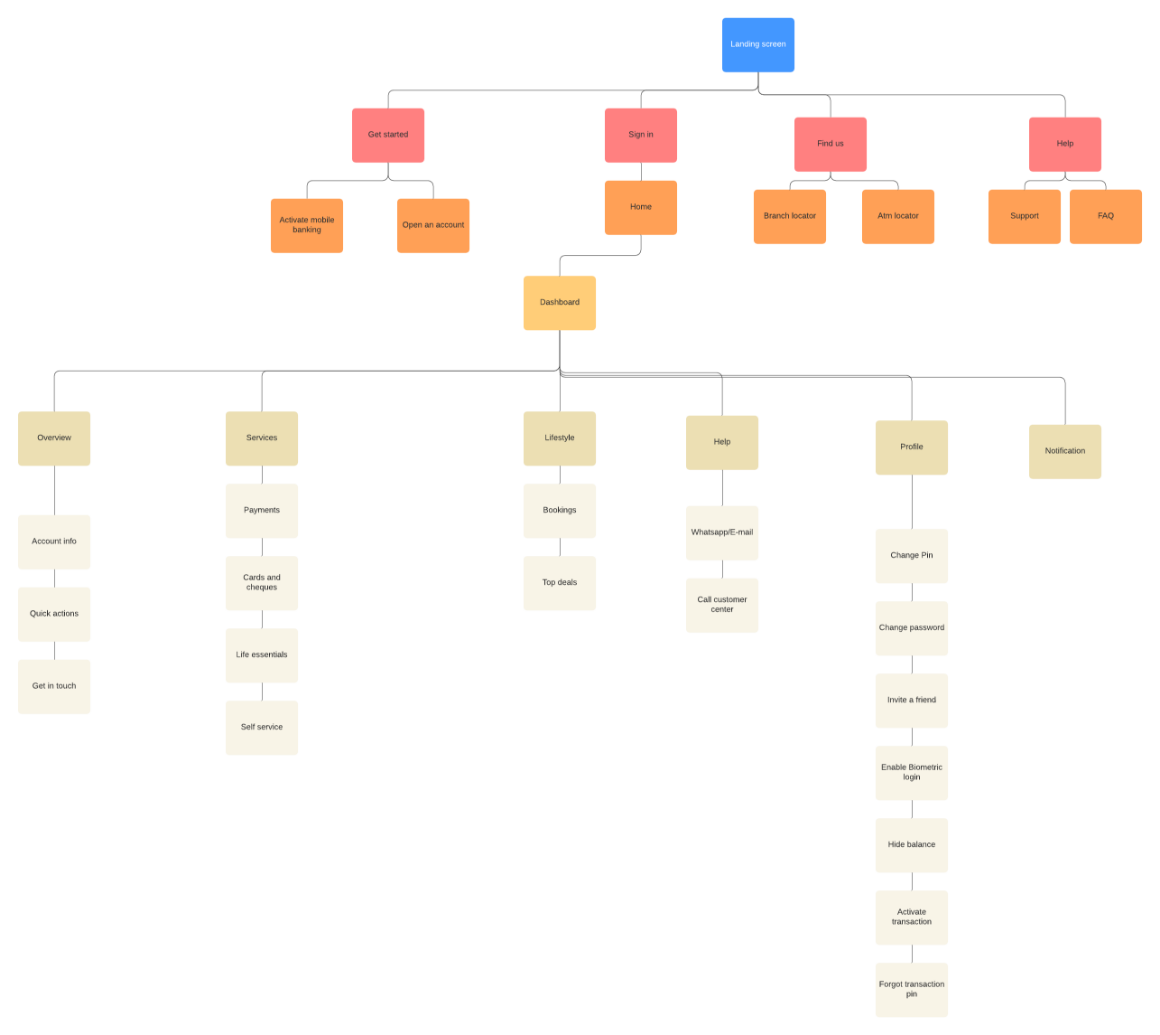
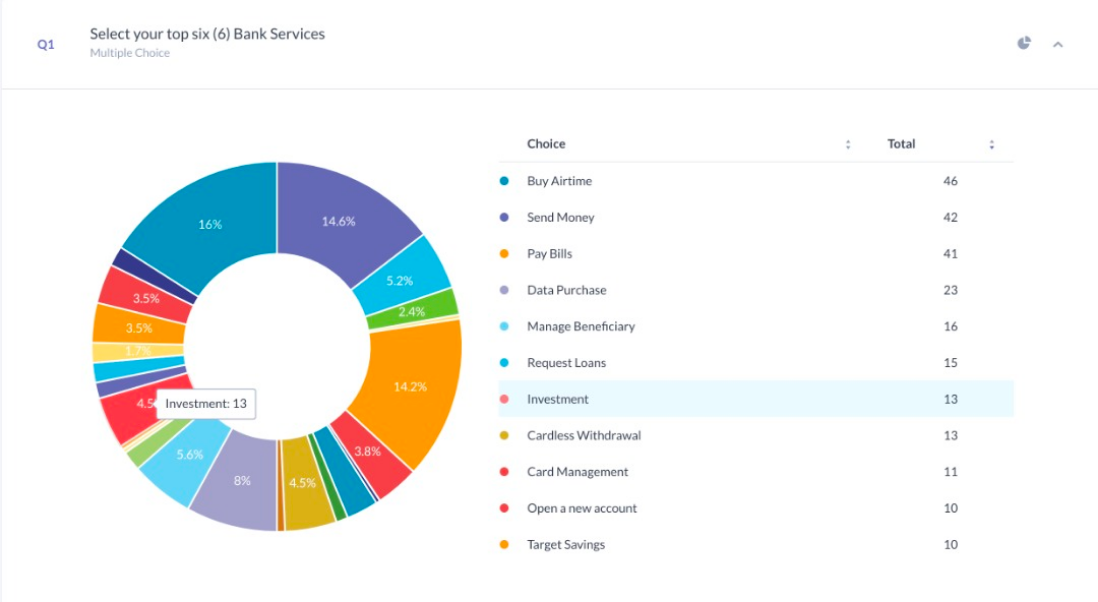
Quick services on the dashboard
One of our goals was to give users access to quick services on the dashboard, and what better way to find out the top services than to speak to our customers. We designed a survey listing all our banking services and requested that they selected their most frequently used. The survey results helped in determining the quick services to show on the dashboard.
Redefining the onboarding process
We discovered that asking potential customers to fund their accounts at the beginning of the account opening process impacted the onboarding process negatively.
1. Customers complained about funding the account being mandatory for the account opening process.
2. The document verification process had a relatively mid-success rate. When it failed, customers did not know how to proceed because there was no error recovery management system, hence the need to visit a bank’s branch to continue the process.
3. They wanted to get their accounts opened in fewer clicks.
Finding a solution
We had several meetings with stakeholders and discussed how we could make the onboarding process seamless.
1. We initially wanted to remove the option to fund the account when opening an account, but this was very important to the business as it increased the bank deposit. We agreed to make it an optional field instead.
2. We collaborated with the tech team to find a vendor with an API having at least a 90% success rate for document verification.
Crafting an intuitive consistent experience
Once I had a better understanding of what I wanted to do and the issues to tackle, I took some time to wireframe some ideas for user testing.

First Iteration
We designed wireframes as it was pertinent to identifying areas of design development to be considered before moving onto high fidelity design. This stage of testing provided insights including:
1. Showing customers the documents required before opening a specific account.
2. The need to reduce time on task for both account opening and the funds transfer process.
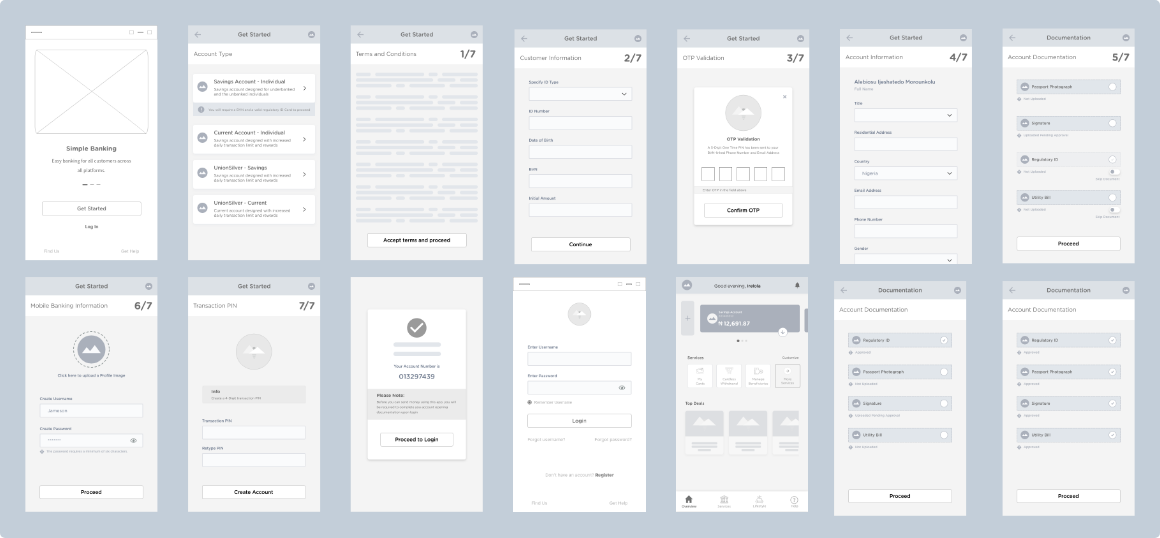
Second Iteration
Some insights from the second iteration:
1. The account opening process was faster; we reduced it from 8 to 6-step process.
2. We reduced the time on task on the send money by integrating an API that returns the bank name as soon as an account number has been inputed in the field.
3. Customers had no difficulty navigating the app.
UBN Hi-Fi Designs
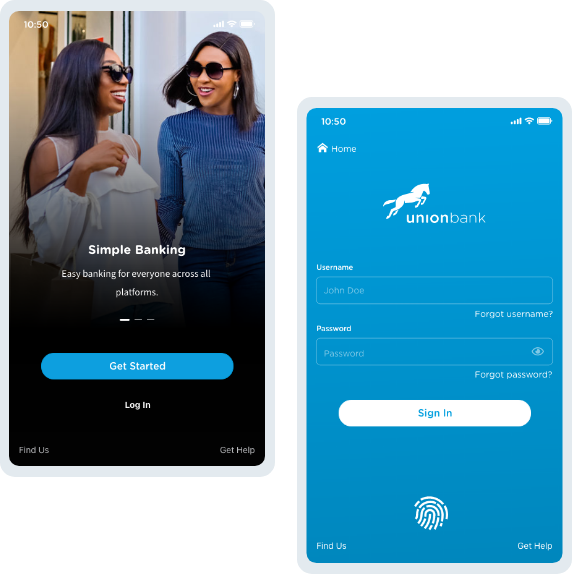
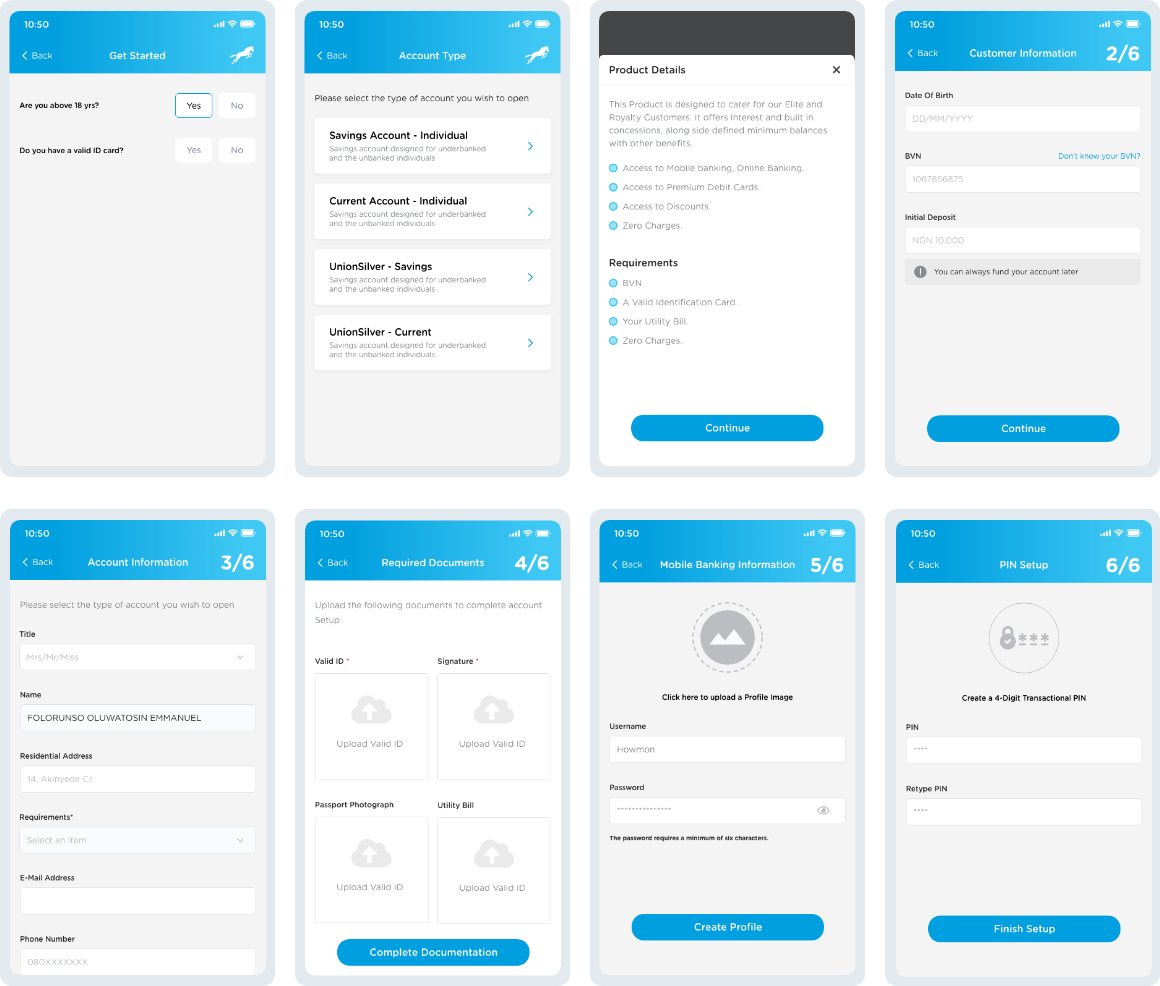
Getting Started.
The get started screens allows both new and existing users to get into the app. Existing users can sign in with either their username and password or fingerprint.
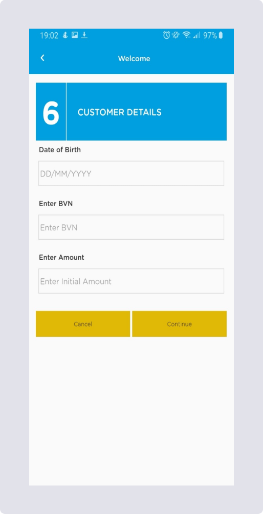
Straight-through account opening process:
We refined our account opening process to be a straight-through process. The retail team revealed that the drop-off rate reduced by 13% and our daily account opening per day went from 100 customers to 200 customers.
-------
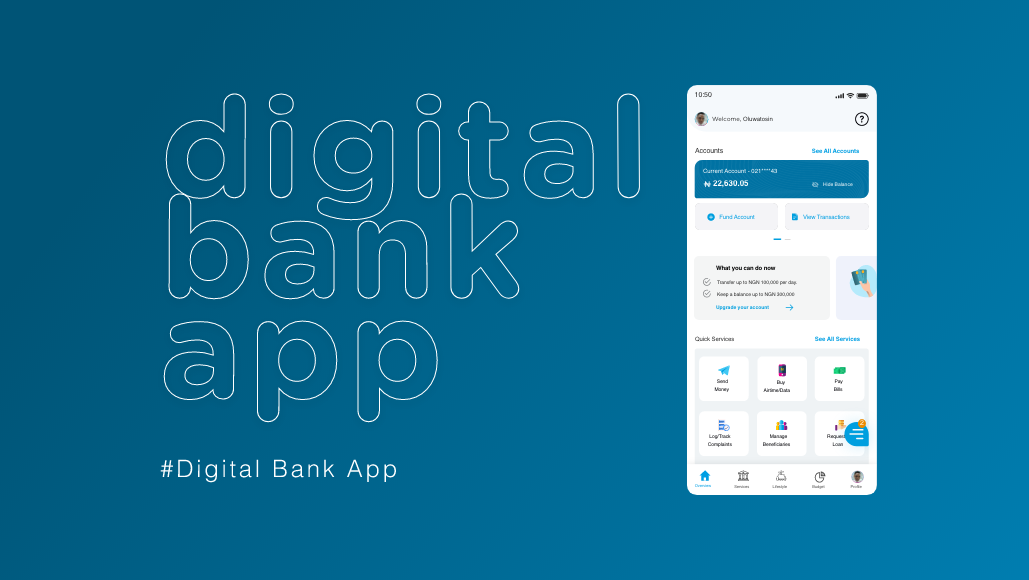
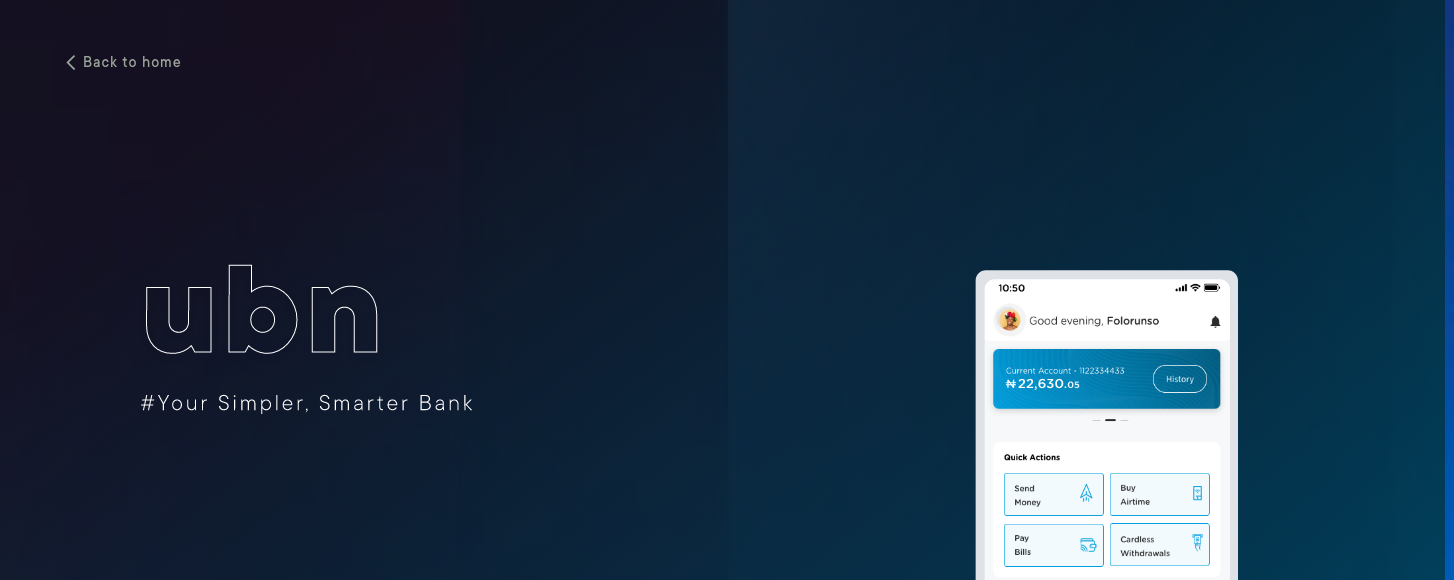
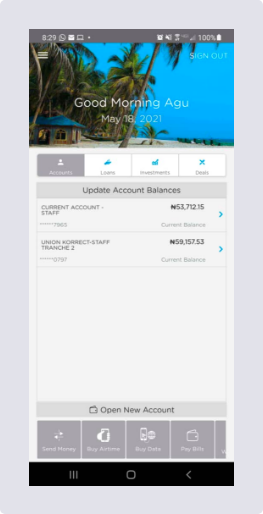
Dashboard:
The new dashboard shows the quick actions and the popular services the customers selected during our survey. The navigation bar also makes access to all other services very easy.

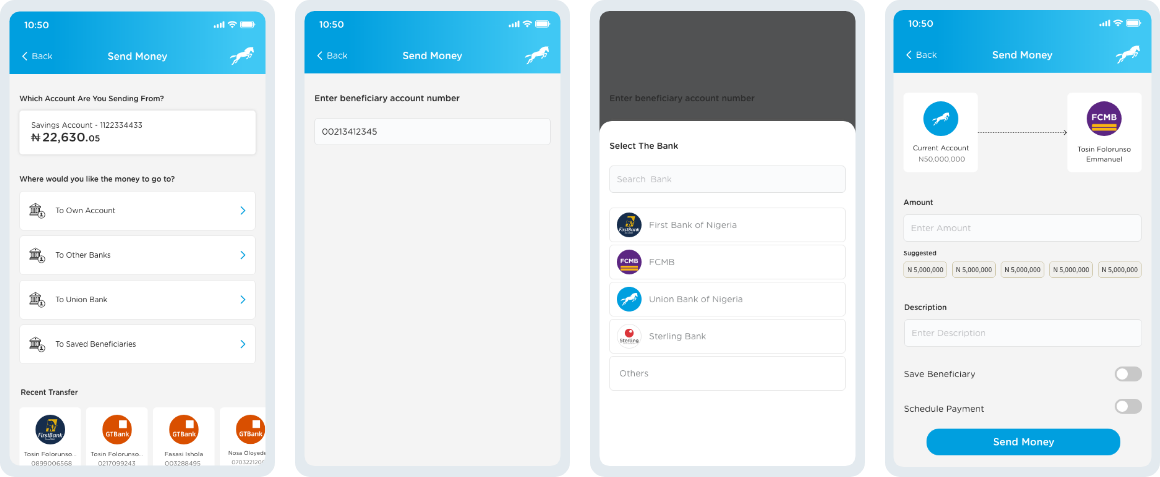
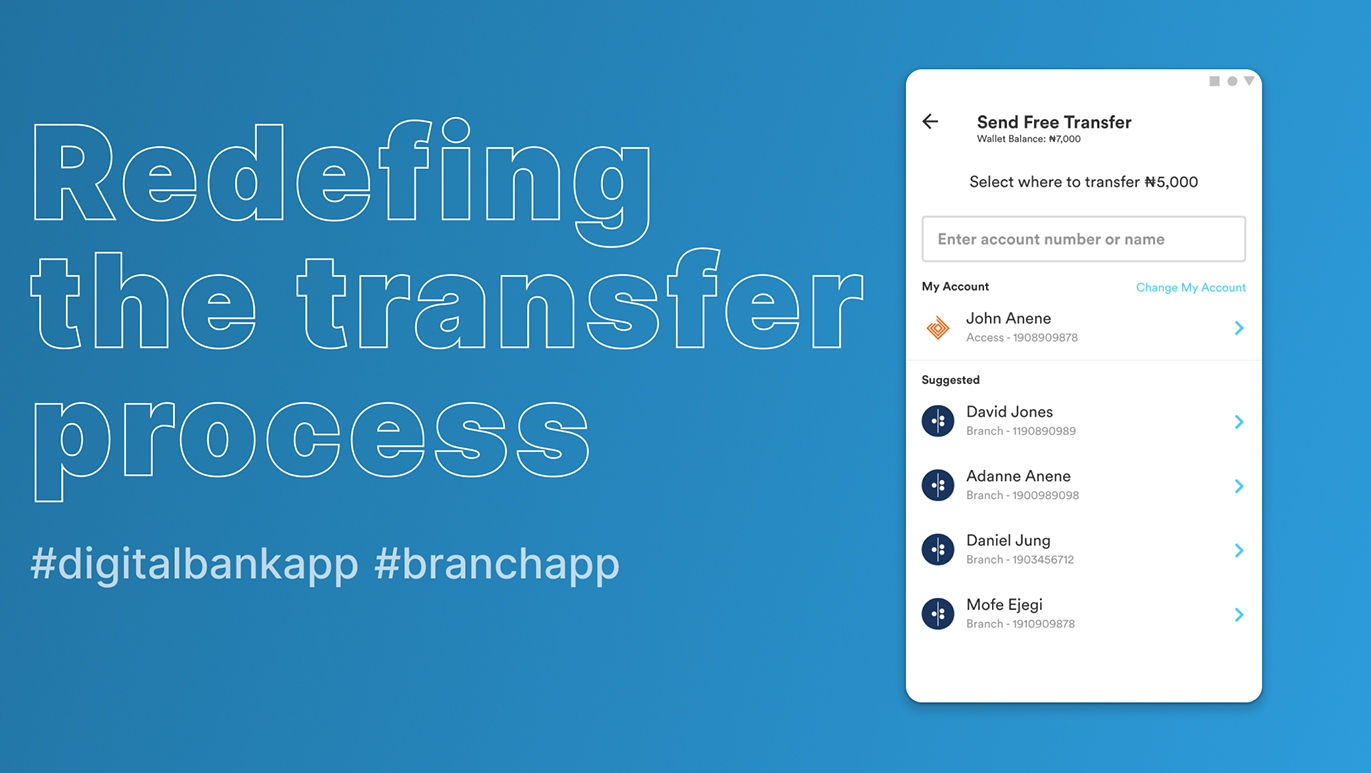
Fund Transfer
The fund transfer process was reduced from a 9-step process to a 7-step process making it faster to transfer funds to a new or existing beneficiary. We added the recent transfers to the interface as requested by the customers.
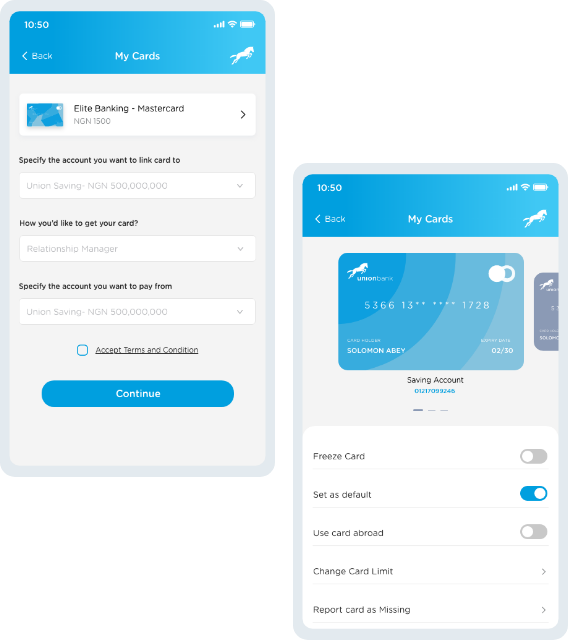
Card Management :
Customers can now request a card without visiting a branch and also get it delivered to them. Managing their cards just became easy as these services are available on the mobile app.
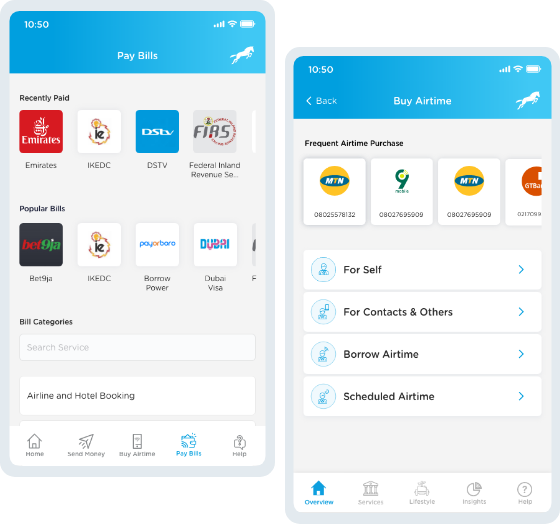
Utility
Customers can search for a biller of their choice, get access to the most popular bills, and see their most frequently paid bills. The bills are organized into various categories for easier accessibility.
Impact
The bank recorded a 10% growth in the number of customer acquisition via the mobile app. There was also a 5% increase in the NPS and CSAT scores respectively.
The mobile app currently has over 1,000,000+ downloads on the IOS App Store and Google Playstore.